GHG emissions by country
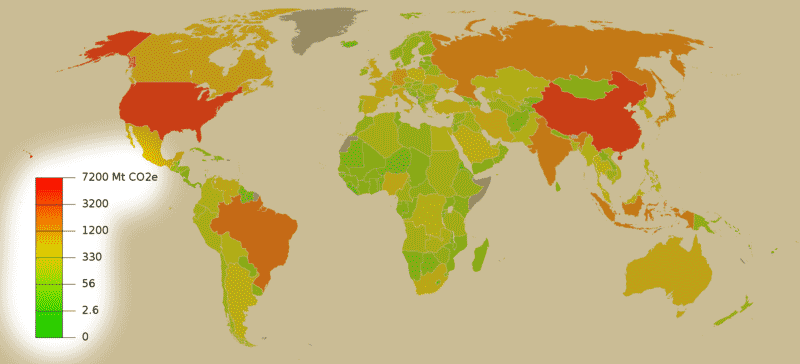
An alternative view, from the London-based Guardian newspaper (note the numbers refer to CO2 only, not all GHGs).  |
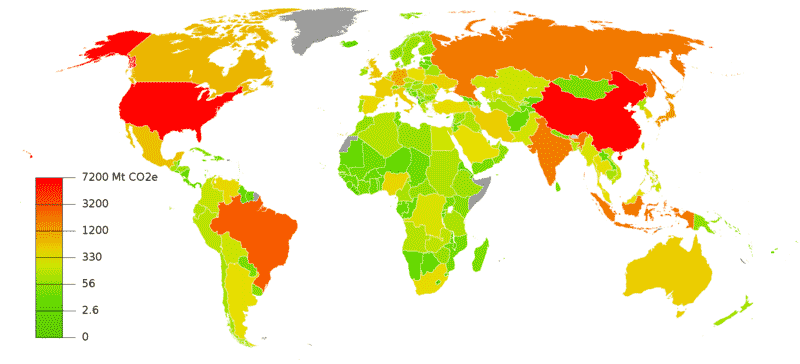
How is the map set up?Each country on the map has its own data. That is, the resolution of this map is at the country-scale. There may be differences within countries, but these are not shown on the map. What are the colors?The color tells you how much greenhouse gas is emitted by the entire country during the course of a year. Greener colors mean less GHG emissions -- all the way down to <1 megaton per year, for some small, undeveloped islands. Redder colors mean more GHG emissions -- up to about 7000 megatons per year each for China and the US. This scale is divided into six boxes. However, notice that the scale is NOT linear -- if it was linear, the scale would need to be about 3000 boxes high, not 6 boxes, and only the bottom 100 or so boxes would be yellow or green. Where did the data come from?"GHG" means all greenhouse gases. CO2 is the most important, but other gases like methane (CH4, from cattle) and nitrous oxide (NO2, from fertilizers), both of which are less common but more powerful than CO2. "Emissions" means the amount of new GHG being put into the atmosphere. Remember that even if all emissions magically stopped tomorrow, the very high level of GHG already in the atmosphere would not disappear overnight -- they would take years to centuries to decay. A list of GHG emissions by country in 2005 can be found by searching wikipedia, i.e., here. What does the data tell us?1. For a long time, the US was the greatest emitter of GHG, but this changed in about 2005 -- however, remember that the Chinese population is about 4 times the US population. 2. Large parts of the world contribute almost nothing to total emissions, including Africa, most of South America, and central and southeast Asia. 3. Some small but highly developed countries, such as Germany and Japan, emit large amounts of GHG. What's the take-home message?China and the US are now the top two emitters of greenhouse gases, suggesting that what their governments and economies do will greatly impact the rest of the world. Is there controversy?Yes, there are controversies about how these numbers of measured, which are discussed on the per capita emission page. But more importantly, the role of China has been very controversial..... Opponents of the Kyoto Protocol, for example, seized on the role of China as a way to block efforts to ratify and implement the Protocol in the U.S. -- claiming that any concessions made by the U.S. would be swamped by future increases in emissions from China. China (along with many developing countries) has argued that the U.S. and Europe were able to grow their economies by taking advantage of fossil fuels, and nations that are now growing quickly should not be denied this opportunity. Clearly the problem is difficult from a number of points of view (economically, morally, politically...) and creative solutions will need to be found if the world is to mitigate climate change.
|
Copyright University of Maryland, 2007
You may link to this site for educational purposes.
Please do not copy without permission
requests/questions/feedback email: mathbench@umd.edu