Heat Waves


|
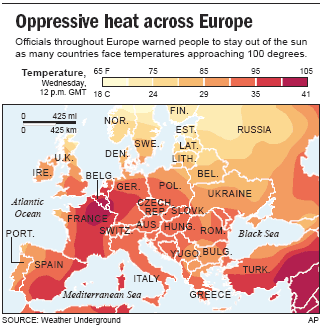
What's on the y-axis?This graph is about summer heat waves in Europe -- specifically on in 2003 (marked with a black 'x') that killed almost 15,000 people in France alone. So, the y-axis shows the increase in average summer temperature in Europe compared to 1900. What's on the x-axis?200 years -- from 100 years ago to 100 years in the future. What are the colorsThe colored lines are model predictions from the various GCMs (see here), while the black line is actual measured temperature. The black line stops in 2003 because that's when the study was done. What does the data tell us?In 2003, Europe experienced a heat wave which may have caused up to 70,000 deaths, due directly to heat and indirectly to reduced crop harvests across the continent. So, look at the black "x" for 2003 -- it's about 2 degrees Celsius above normal. Remember that an average of 2 degrees can translate to LOCAL heat waves that are much bigger -- for example, in Greece the temperature topped 114 degrees Fahrenheit. Now look at the temperature predictions over the next 10-20 years. Within this time period, the heat wave that Europe experienced will go from being highly unusual to being a normal hot summer. And by about 2060, the 2003 heat wave may become a normal "cool" summer. What's the take-home message?When average temperatures change, so do the highs (and lows) that we can expect. This means, in particular, more severe heat waves. Is there controversy?The fact of the heat wave is pretty unarguable. France was particularly hard hit, and there has obviously been a lot of controversy about who was to blame. The heat wave hit in August, the traditional 'holiday' month -- when local businesses close, and many family doctors go on vacation. Many of those that died were elderly who were healthy enough to live on their own, and were not in close contact with their families. In addition, French summers are typically mild, most homes don't have air conditioning, many people don't know how to deal with the heat, and local governments had no contingency plans. So, many elderly died while their families were out of town, and were not found for days or weeks. Some people blame the doctors for being gone, some blame the families for not being in touch, and some blame the government for not having plans. |
Copyright University of Maryland, 2007
You may link to this site for educational purposes.
Please do not copy without permission
requests/questions/feedback email: mathbench@umd.edu
