Keeling Curve
|
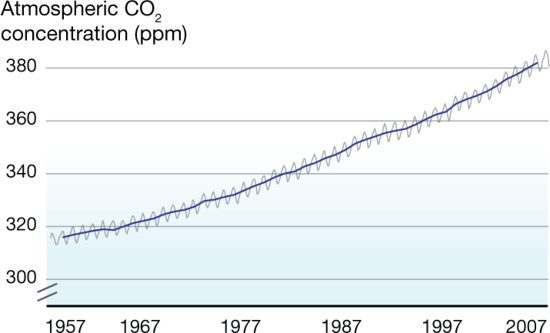
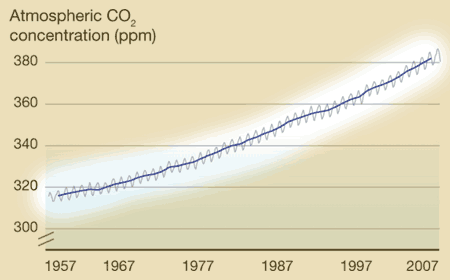
What's on the y-axis?The amount of CO2 in the atmosphere, which is measured in ppm, or parts per million. So at the beginning of 1957, there were about 315 molecules of CO2 for every 1,000,000 molecules of air (which is mainly oxygen and nitrogen). What's on the x-axis?Time. Charles Keeling started making measurements in 1957, and those measurements continue to the present day. Every year, the curve gets updated with new data. Where did the data come from?Originally Keeling, who had just gotten his doctorate degree, took measurements near where he lived, but he knew he needed to find someplace that would be more protected from daily ups and downs of city life. Eventually he got funding to make the observations at the Mauna Loa observatory in Hawaii. What does the data tell us?1. Every year, CO2 levels rise and fall -- this has been compared to the earth breathing in in the spring (trees grow, taking carbon dioxide in to make leaves and new wood, so CO2 levels fall slightly) and out in the fall (trees drop their leaves, which decay, releasing CO2 into the atmosphere again. This cycle is mostly unaffected by humans. 2. Year after year, the level of CO2 in the atmosphere increases slightly. In 1957, CO2 averaged about 315 ppm. In 2007, it averaged about 385 ppm. The yearly increase evens seems to be getting a little faster over time (i.e., the long-term trends curves up a little). What's the take-home message?Although CO2 rises and falls every year, there is a long term trend of steady increase. Is there controversy?Not really. Back in the 1950's, no one really knew what happened to the CO2 put into the atmosphere from burning fossil fuels, and Keeling's data provided the first hard evidence that CO2 was accumulating. Therefore, the Keeling Curve built the foundation for our current understanding of climate change. However, Keeling was known as a stickler for detail, and no one has ever seriously challenged his methods or findings. Listen to a fascinating description of Charles' Keeling by his wife and son here. |
Copyright University of Maryland, 2007
You may link to this site for educational purposes.
Please do not copy without permission
requests/questions/feedback email: mathbench@umd.edu
