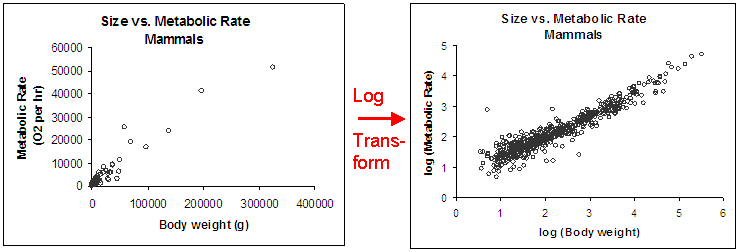
The log transformation
Data for scaling studies are almost always displayed and analyzed using log-transformed data. We are going to show you why and how - and make sure you are comfortable looking at these kinds of data and graphs. To do this, we are going to use our full data set of 600 mammals, and you will see why it is easier to see and analyze patterns in the data. In fact, you can see it just by looking at this picture!

Copyright University of Maryland, 2007
You may link to this site for educational purposes.
Please do not copy without permission
requests/questions/feedback email: mathbench@umd.edu