Final Words of Wisdom, and Some Graph Paper
- Choose your x and y variables carefully.
- Label your x and y axis using both a description and the units in parentheses, and the top of the graph with a description of what the graph shows
- Figure out the best minimums and maximums for x and y
- Figure out the best distance for ticks.
- Include a legend if there's more than one data series
- Graph the data!
Two graphs you may need to make right now...
1. An absorption spectrum, showing the wavelengths that get absorbed by a particular solution.
When you do this experiment, you (the person in the white coat) get to set the wavelength that you want to test, and then the machine tells you how much got absorbed. So which variable is the X variable?...
Wavelength is measured in a very small unit -- nanometers. Blue-violet is the shortest, at around 400 nm, and red is the longest at 700 nm. So this is one case where you DON'T need to start at 0. What is a good tick distance if the min and max are 400 and 700?
"How much gets absorbed" is measured in OD units, which generally top out at 4. Which means a good tick distance would be ...
2. A standard curve relating concentration to how much lights get absorbed.
In this case, you (still in a white coat) laboriously created several solutions of different concentrations. So what is the X variable?
The concentrations ranged from 0 (the blank) up to some maximum, depending on your lab... but it was probably close to 100% (yes, 80% is close to 100%). So, good choices for minimum, maximum, and tick distance would be...?
"How much gets absorbed" is measured just like in graph 1.
For your reference,
here is the Checklist again:
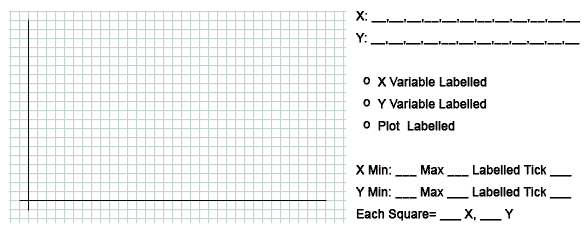
And here is some graph paper which you can print and use for sketching graphs (for lab reports, you may need to hand in a full-page graph).

If you want a printer-friendly version of this module, you can find it here in a Microsoft Word document. This printer-friendly version should be used only to review, as it does not contain any of the interactive material, and only a skeletal version of problems solved in the module.
Copyright University of Maryland, 2007
You may link to this site for educational purposes.
Please do not copy without permission
requests/questions/feedback email: mathbench@umd.edu