Finally, fill in the axes
Time to graph
To make this interactive, turn on javascript!
| Water Temp, celsius | 3 | 6 | 9 | 12 | 15 | 19 | 23 |
|---|---|---|---|---|---|---|---|
| Survival, percent | 100 | 100 | 72 | 34 | 22 | 17 | 3 |
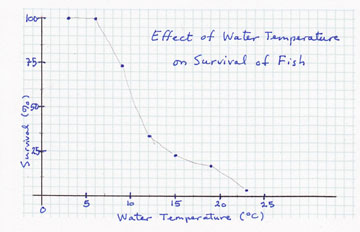
Time to Graph...
To make this interactive, turn on javascript!
| Year | 1995 | '96 | '97 | '98 | '99 | 2000 | '01 | '02 | '03 |
|---|---|---|---|---|---|---|---|---|---|
| # Collisions | 1244 | 1776 | 1705 | 1774 | 1891 | 2033 | 2003 | 2127 | 2047 |
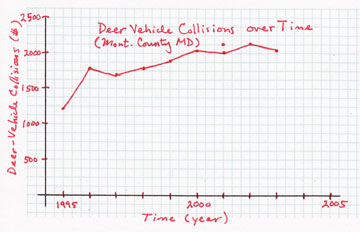
Time to Graph...
To make this interactive, turn on javascript!
| Weeks since conception | 8 | 12 | 16 | 20 | 24 | 28 | 32 |
|---|---|---|---|---|---|---|---|
| weight of embryo, g | 55 | 108 | 160 | 201 | 244 | 295 | 348 |
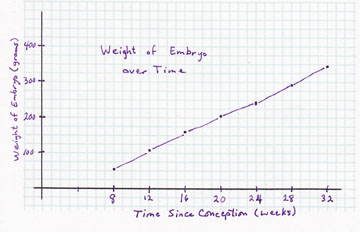
Time to Graph...
To make this interactive, turn on javascript!
| Food, mg | 0.1 | 0.3 | 0.5 | 0.7 | 0.9 |
|---|---|---|---|---|---|
| Growth, mg/day | 0.01 | 0.032 | 0.6 | 0.65 | 0.68 |
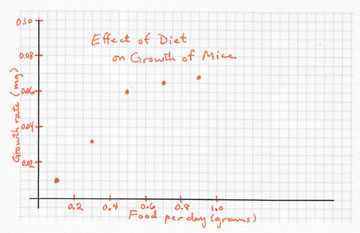
Time to Graph...
To make this interactive, turn on javascript!
| Dosage, mg | 10 | 50 | 100 | 150 | 200 |
|---|---|---|---|---|---|
| Time to relief , min | 25 | 10 | 5 | 2 | 1 |
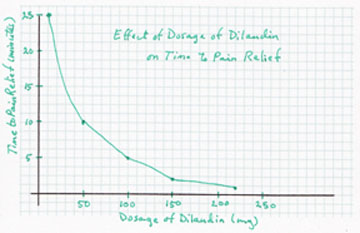
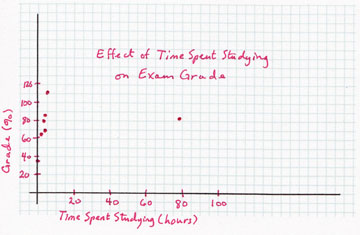
This one has an "outlier"...
To make this interactive, turn on javascript!
| Time Studying, hrs | 0 | 1 | 1.5 | 2 | 3 | 5 | 78 |
|---|---|---|---|---|---|---|---|
| Grade, percent | 37 | 62 | 68 | 87 | 79 | 111 | 82 |
Copyright University of Maryland, 2007
You may link to this site for educational purposes.
Please do not copy without permission
requests/questions/feedback email: mathbench@umd.edu