Practice ranging the axes
On this screen there are several practice sets of data. For each set, you should think about what data is on the x-axis, and what data goes on the y-axis. Click the buttons to pick the axes, and then click the "check" button to see if you have the answers right (in some cases, the "right" answer is a matter of judgement, and the answers I give are the ones that I think make the most sense).
 Decide min and max...
To make this interactive, turn on javascript!
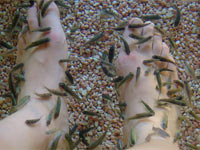
| range | min | max | |
| "x":Water Temp. (d. Celsius) | 3 to 23 | ||
| "y": Fish Survival (%) | 3 to 100% |
 Decide min and max...
To make this interactive, turn on javascript!
| range | min | max | |
| "x": Food per Day (g) | 0.1 to 0.9 | ||
| "y": Growth Rate (g/d) | 0.01 to 0.088 |
 Decide min and max...
To make this interactive, turn on javascript!
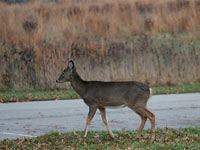
| range | min | max | |
| "x": time (yr ) | 1995 to 2003 | 2005 | |
| "y":Deer-Vehicle Collisions (#) | 1244 to 2147 |
 Decide min and max...
To make this interactive, turn on javascript!
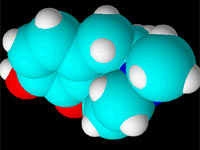
| range | min | max | |
| "x": Dosage of Dilaudin (mg) | 10 to 220 | 0 | |
| "y": time to relief (min) | 1 to 25 | 0 | 25 |
 Decide min and max...
To make this interactive, turn on javascript!
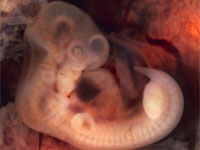
| range | min | max | |
| "x": Time since conception (weeks) | 8 to 32 | 0 | 35 |
| "y": Size of Embryo (g) | 55 to 348 |
 Decide min and max...
To make this interactive, turn on javascript!
| range | min | max | |
| "x": Time Spent Studying (hrs) | 0 to 78 | 0 | |
| "y": Grade on Exam (%) | 37 to 111% | 0 |
Copyright University of Maryland, 2007
You may link to this site for educational purposes.
Please do not copy without permission
requests/questions/feedback email: mathbench@umd.edu