How to scale axes
The preceding steps -- choosing x and y, labeling, deciding on min and max values, and deciding on tick distance -- are steps you need to do for any graph you make, whether you use a computer or sketch the graph by hand. (Often a computer program will do these steps for you, but often the program will get them wrong, too).
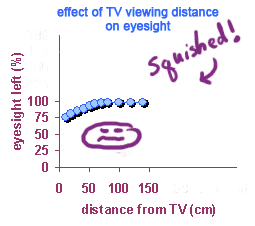
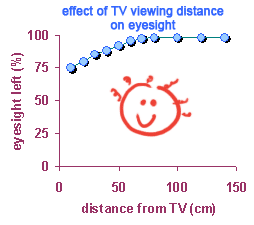
If you are drawing a graph on paper, there is just one more complication. The graph paper has predetermined lines, and you need to make your graph fit on the page or half-page or whatever. You don't want an effect like the graph on the left!
 |
 |
I'm sure there's a formula for doing this, somewhere. But you can also manage by trial and error. On the graph above, let's say you need to approximately fill up a space which has 40 lines for the x-axis.
If you make each line 10 cm, you'll only use up 15 lines -- too few
If you make each line 2 cm, you'll need 75 lines -- too many (This is starting to sound like a nursery story...)
If you make each line 5 cm, you'll need 30 lines -- just right (or at least right enough).
Copyright University of Maryland, 2007
You may link to this site for educational purposes.
Please do not copy without permission
requests/questions/feedback email: mathbench@umd.edu