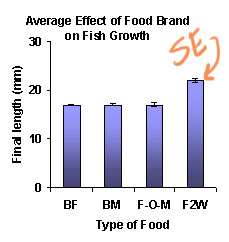
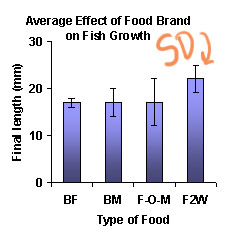
The same graph both ways
If you get confused between standard deviation and standard error, here are some suggestions:
1. Standard deviation is about how far members of the population deviate from the average. It is a characteristic of the population, so it doesn't depend on how many members you sample (except that if you only sample a few members, you won't get a good estimate of SD).
If you are trying to describe variability in a population, you probably want to use standard deviation.
2. Standard error is about how much error you, as an experimenter, cannot rule out from your results. SE falls steadily as you sample more and more members of the population. No matter how "ragged" the population is, some TRUE mean exists, and SE tells you how accurately you can measure this true mean.
If you are trying to support or reject a hypothesis -- in other words, when you are reporting on the results of an experiment -- you will most likely be using Standard Error for your error bars .
Which graph will be more useful for each question below?
SD or SE?The Budget Fude people take exception to your results, and carry out a ginormous experiment in an Olympic-size swimming pool divided in half, containing 10,000 fish. They claim that under the right temperature conditions, Budget Fude is superior to Fish2Whale. Are they interested in SD or SE? |
SD or SE?The University wants to choose a brand of fishfood to feed their fish during experminents on critical temperature limits. It is important that the brand they choose produces fish that are as similar as possible. Are they interested in SD or SE? |
 |
 |
|---|
Copyright University of Maryland, 2007
You may link to this site for educational purposes.
Please do not copy without permission
requests/questions/feedback email: mathbench@umd.edu