Another way to add info: the standard error
Graphs using standard deviation (SD) tell you what a big population of fish would look like -- whether their sizes would be all uniform, or somewhat raggedy, or totally raggedy. Sometimes, though, you don't really care what a population looks like, you just want to know, did a treatment (like Fish2Whale instead of other competing brands) make a difference on average? In that case you measure a bunch of fish because you're trying to get a really good estimate of the average effect, despite whatever raggediness might be present in the populations.
 Let's say your company decides to go all out to prove that Fish2Whale really is better than the
competition. They convert a supply closet into an acquarium, hatch 400 fish, and tell you to do a
HUGE experiment. The whole idea of the HUGE experiment is to get a really accurate measurement of
the effect of Fish2Whale, despite the natural differences such as temperature, light, initial size
of fish, solar flares, and ESP phenomena. The return on their investment? Really small error bars.
Let's say your company decides to go all out to prove that Fish2Whale really is better than the
competition. They convert a supply closet into an acquarium, hatch 400 fish, and tell you to do a
HUGE experiment. The whole idea of the HUGE experiment is to get a really accurate measurement of
the effect of Fish2Whale, despite the natural differences such as temperature, light, initial size
of fish, solar flares, and ESP phenomena. The return on their investment? Really small error bars.
But how do you get small error bars? Just using 400 fish WON'T give you a smaller SD. A huge population will be just as "ragged" as a small population. Instead, you need to use a quantity called the "standard error", or SE, which is the same as the standard deviation DIVIDED BY the square root of the sample size. Since you fed 100 fish with Fish2Whale, you get to divide the standard deviation of each result by 10 (i.e., the square root of 100). Likewise with each of the other 3 brands. So your reward for all that work is that your error bars are much smaller:
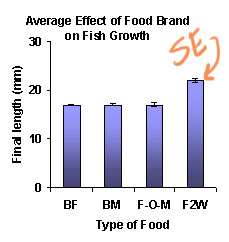
Why should you care about small error bars? Well, as a rule of thumb, if the SE error bars for the 2 treatments do not overlap, then you have shown that the treatment made a difference. (This is not a statistical test, but simply a way to visualize what your results mean. Many statistical tests are actually based on the exact amount of overlap of the SE bars, but they can get quite technical. For now, we'll just assume that no overlap = a true difference between the treatments.)
So, in order to show that Fish2Whale really is better than the competitors, NOT ONLY does the mean growth need to be higher, but (mean minus SE) for Fish2Whale must be bigger than (mean plus SE) for the other brands. In other words, the error bars shouldn't overlap. It's a little easier to see on a graph:


| If you turn on javascript, this becomes a rollover |
No overlap means the 2 treatments really had different effects (on average). If there is overlap, then the two treatments did NOT have different effects (on average). The good news is, you already know how to make this kind of graph. Just use the SE instead of SD and you're good.
 |
 |
|---|
Copyright University of Maryland, 2007
You may link to this site for educational purposes.
Please do not copy without permission
requests/questions/feedback email: mathbench@umd.edu