Info lost and found
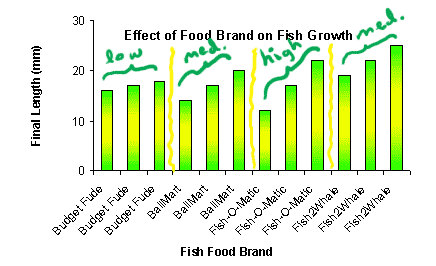
I think we can agree that the summarized barchart is more elegant than the unsummarized one. But unfortunately, we lost some information when we summarized (averaged) the data. You can no longer look at the graph and get any sense of how much growth varied.
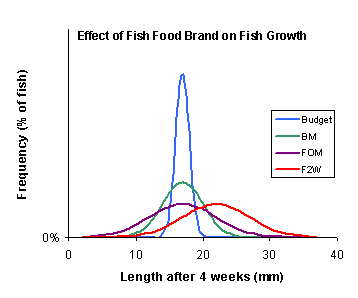
If you look at the graph below, you can see that one brands produced very CONSISTENT growth rates, and one brand produced very VARIABLE growth rates. That is, one brand showed high variability, one showed low variability, and two showed medium levels. See if you can identify the level of variability for each of these brands -- then put your mouse on the picture to check your predictions.

| If you turn on javascript, this becomes a rollover |
The standard deviation (SD), which we talked about in module 2, is one way to measure how consistent or variable a result is. Recall that a small standard deviation would mean the normal distribution is skinny and tall, and most of the measurements (final fish sizes) are about the same. A big standard deviation would mean the normal distribution is wide and low, and the measurements (final fish sizes) are all over the place.
Unfortunately, SD is a bit tricky to calculate, not to mention time-consuming and frustrating. What we're going to do instead is the AVERAGE deviation, which is a good approximation of the standard deviation.
Say you have 10 fish, with an average length of 100. The first fish actually measures 91 mm, so that one DEVIATES from the average by 9 mm. The second one measures 105 mm, so that one DEVIATES by 5 mm (notice it doesn't matter whether the deviation is above or below average). If you find all 10 deviations AND THEN AVERAGE THEM, you will get the average deviation.
This is very similar to the formula for the standard deviation, except the SD has some squares and square roots tossed in that make it play nicely with other statistics.
Fish-O-Matic had the highest variability of any of the four brands. What is the approximate standard deviation of growth for this brand?
| Fish # | 7 | 8 | 9 |
|---|---|---|---|
| Brand | F-O-M | F-O-M | F-O-M |
| Final Length (mm) | 12 | 17 | 22 |
(To make this problem interactive, turn on javascript!)
- I need a hint ... : Use average deviation : Remember that the Standard Deviation is
almost the same as the AVERAGE deviation -- how far on average a given fish deviates
from the average final length.
- ...another hint ... : The average final length: (12 + 17 + 22)/3 = 17 mm.
- ...another hint ... : The deviation for fish #7: Fish #7 deviates by (17-12)= 5 mm.
- ...another hint ... : The average deviation : The three fish deviate by 5, 0, and
5 mm. Take the average of these deviations to get...
I think I have the answer: 10/3 = 3.33 mm
The actual standard deviation is a bit larger than the average deviation -- in this case 5 mm rather than 3.33. Below is a table of each brand, the average growth, and the standard deviation:
| Fish # | 1 to 3 | 4 to 6 | 7 to 9 | 10 to 12 |
|---|---|---|---|---|
| Brand | BF | BM | FOM | F2W !! |
| AVERAGE Growth (mg/day) | 17 | 17 | 17 | 22 |
| Average Deviation of Growth (mg/day) | 1 | 3 | 5 | 3 |
Assuming that
- growth of fish is normally distributed (it should be, since many factors contribute), and
- that we have accurately measured the mean and standard deviation of growth for each type of fish food,
then the distributions of actual growth should look like this:

But the summarized version of our barchart loses all of this information.
Copyright University of Maryland, 2007
You may link to this site for educational purposes.
Please do not copy without permission
requests/questions/feedback email: mathbench@umd.edu