When will the pox peak? And will the tournament go on?
Prediction: Threshhold value of S is 142.
Day 14: S: 410 I: 158 R: 32
Day 15: S: 353 I: 175 R: 72
Three methods of prediction:
Method 1: Calculator I mean, magic wand
QHA: Whip out your trusty 8 and three quarter inch TI-84 (or whatever other calculator you have on hand) and figure out how many students are predicted to be susceptible, infected, and recovered on day 16. Cmon now, this is a contact sport. No fair just looking at the answer.
Hint: For S, take the day 15 value of S and multiply it by the day 15 value of I, multiply that by 0.001, and subtract it from the day 15 value of S. Voila.
Hint: Heres a slightly tricky part. When you calculate I, make sure you use the day 15 values, not any new day 16 values you may have calculated.
Answer: Day 16: S: 292 I: 211 R: 97
Obviously you could continue to do this until you got to an S that was smaller than 142, and you would know when the pox would peak, and approximately how many would be sick.
Method 2: Seat of the pants.
Nothing fancy here. There were about 50 newly sick students on day 15. Keep that up for 4 more days, and S should be just above 142. So the epidemic will likely peak around day 19.
Method 3: Spreadsheet.
(Introduced by the new Professor of Mathemagics maybe involves house elves). The easiest way to see what is going on is to use a computer programmer or spreadsheet to do the dirty work for you. The screen shot below shows a piece of a spreadsheet which simulates the system of rate-of-change equations that weve been discussing.
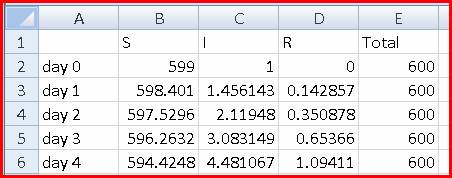
The initial conditions (day 0, in red) are typed directly into the spreadsheet. Everything else is calculated by formulas. The total column is only there to provide a check that everything else is working. Here are the formulas used for day 1:
S (in call B3): =B2-0.001*B2*C2
I (in cell C3): =C2 + 0.001*B2*C2 - (1/7)*C2
R (in cell D3): =D2+(1/7)*C2
Total (in cell E4): =SUM(B3:D3)
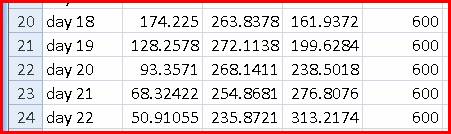
Once the day 1 formulas are written, you can use copy-paste or fill-down to make them apply to however many days you choose.
Using his spreadsheet, the professor of Mathemagics predicts that the pox will peak on day 19, with 272 sick. By the day of the tournament (day 21) there should be 255 sick students, which leaves over 300 well-students to compete.
Copyright University of Maryland, 2007
You may link to this site for educational purposes.
Please do not copy without permission
requests/questions/feedback email: mathbench@umd.edu