>Episode 1: The Blue-Hair Backstory
Random Mating is the Key
|
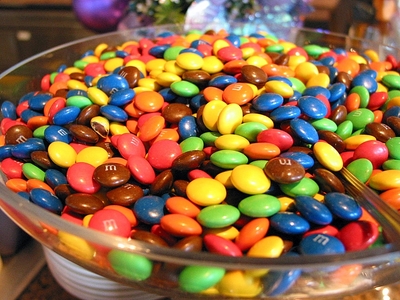
Armed with these new results, the assistant headed back to the ME. "According to my results, approximately 50% of the population should be unaffected by the blue hair syndrome, 40% should be silent carriers..." "What?" interruped the ME, "They won't be able to talk?" "Noooo, they just won't show, the gene won't be expressed.... and 10% should actually be born with blue hair." The ME traced a histogram on his desk. "So you claim that these alleles are "assorting independently", do you! And that a new "person" is formed by two RANDOMLY chosen alleles coming together!" The assisstant took a step back, "Yes..." "Isn't it possible, my fine young assistant, that people with blue hair would be more attracted to other people with blue hair?" "You mean birds of a feather stick together?" "Exactly." "Let's not split hairs, but I see you have a point. However, can we just stick with the assumption for now?" "When I was coming up," sniffed the ME, "we did things the hard way. And we liked it!" He shrugged his shoulders. "All right then, we have people "randomly" mating to produce offspring. Like randomly choosing 2 m&m's out of a bag?" He offered the assistant a bowl of M&Ms. "By George, I think you've got it," said the Assistant. The ME grinned a chocolately M&M grin. "So, if you know what proportion of the m&ms are Blue, shouldn't you be able to predict, EXACTLY, what proportion of the offspring will have Blue hair and what proportion will be silent carriers?" The Assistant patted his pockets. "Must have left my abacus in my other pants. Let me just, ah, get back to you..." |
Using a handy bag of m&m's, or the applet on the last page, you can simulate the approximate distribution of genotypes, given that the distribution of alleles is B = 70%, b=30%: (mouse over the image for phenotypes!)
It is crucial to notice that there are TWO DIFFERENT distributions that we're interested in:
- allelic distribution, which is 70/30. These proportions are so important we call then p (proportion of the dominant allele) and q (proportion of the recessive allele).
- genotypic distribution, which we're still trying to figure out, but we just simulated as approximately 50/40/10.
You create a bridge from the allelic distribution to the genotypic distribution by assuming random mating:
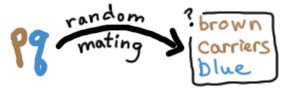
When you chose two m&m's randomly out of a cup, this is essentially the same thing as randomly 'mating' the m&m's. The process is also called 'random assortment', and it is a cornerstone of the Hardy-Weinberg Equilibrium (which we are working our way up to, I promise you!)
The assumption of random mating allows you to calculate EXACT probabilities for each of the three possible genotypes (BB, Bb, bb, in this case), using the laws of AND and OR. This is of course more useful than just calculating the minimum and maximum possible for each genotype, and more convenient than simulating hundreds of offspring.
However, as you just saw, in small populations (such as 100 individuals), the actual proportions of the three genotypes vary quite a bit, due to random chance. In fact, the EXACT probabilities will not necessarily be achieved even for very big populations. But, if you look at very large populations, the actual probabilities should be pretty close to the predicted probabilities.
 To see how to use the laws of AND and OR here, turn to the next page...
Copyright University of Maryland, 2007
You may link to this site for educational purposes.
Please do not copy without permission
requests/questions/feedback email: admin@mathbench.umd.edu