Negative rates = Shrinkage
Notice how all of the problems we’ve done so far have a positive rate of growth? Of course, positively growing bank accounts are not always very realistic. For example, if you consistently overspend by the same amount, your account will look more like this:
But it's also possible to lose some PERCENTAGE of your money every month or year or whatever. That can happen during a recession -- when you might see headlines like "the value of IRAs fell by 12% for the third month." In this case, a biologist would say (somewhat confusingly) that the rate of “growth” is NEGATIVE.
 So what does a negative rate of growth look like?For example, if you have a stock portfolio that is LOSING 5% per year? Obviously you would expect the amount in the account to decrease, but exactly what would the graph look like?
First of all, a straight line seems unlikely. In order to get a straight line, you need to lose the SAME AMOUNT during every time period, and that's not going to happen if you're losing 5% of the balance. So let’s rule out the straight line.
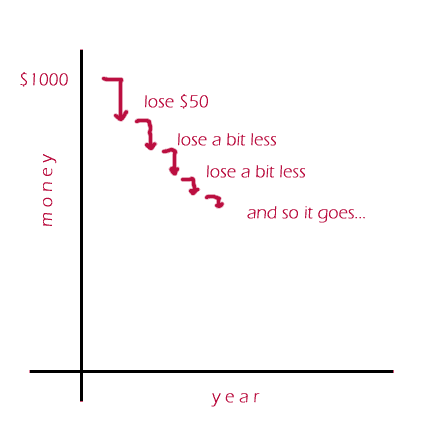
 Instead, let's think about some real numbers. If you have $1000 and lose 5%, that’s $50 gone, so next year you only have $950 dollars left. In the second year, you lose 5% of the $950 … and whatever that number is, it’s LESS than $50 – you lose LESS the second year compared to the first, or in other words, your balance doesn’t go down as fast (obviously it still goes down, unfortunately!)
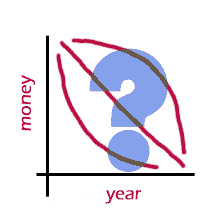
So what does that kind of graph look like? (use your mouse to see the line).
On the graph below, draw the line that would represent losing 5% per year:
So the graph of "negative exponential growth" is ALWAYS a line curving downward toward zero.
Copyright University of Maryland, 2007
You may link to this site for educational purposes.
Please do not copy without permission
requests/questions/feedback email: mathbench@umd.edu