Graphing fruit fly populations
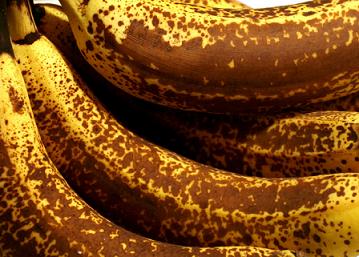
 Now let’s try the same thing with an animal population. True story -- last winter I bought some overripe bananas. Within a few days I noticed a couple of little black buzzing things that liked to fly straight at my face (hey, just because I'm an ecologist doesn't mean I can identify household pests!). It turns out they were fruit flies. Since it was the holiday season, I decided to be charitable and ignore them. After a couple of weeks of spitting out little black drosophila, I happened to look up at the ceiling -- you guessed it, covered in fruit flies, evenly spaced about 4 inches apart.
Based on that experience, I made a highly subjective estimate of fruit fly growth rates (now that's something I'm qualified to do!). What I came up with was about 30% per day.
So, starting with an original complement of 6 lonely fruit flies, can you reproduce my fruit fly invasion graphically below? (Again, just try to get the line to start in the right place, and have the correct general shape).
As you can see, the 30% increase in fruit flies per day resulted in a very noticeable upward curve -- both on the graph and in my home. You also may have realized that the exponential growth model doesn't exactly fit biology:
- a fruit fly produces many eggs at once, so an increase of 2 flies per day is not very realistic, and
- fruit flies (and other animals) reproduce in whole numbers -- not 1.8 babies as in the first day of this model.
The model is clearly a simplification of reality ... but it is a simplification that works really well in a lot of cases.
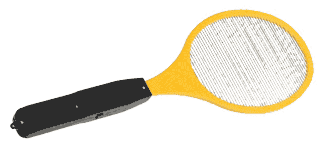
 By the way, in case you are ever similarly invaded, a trap made out of mashed bananas in wine is supposed to work, but mine were too smart for that. I ended up hunting them down with an electric bug-zapper shaped like a tennis racket. It was very satisfying.
Copyright University of Maryland, 2007
You may link to this site for educational purposes.
Please do not copy without permission
requests/questions/feedback email: mathbench@umd.edu