Hockey Stick controversy
Mann and his group were basically the first to attempt such a broad-range reconstruction of temperature history, integrating data from many sources. This graph was hugely influential, both within and beyond the scientific community. In one fell graphical swoop, it solidified an argument for a warming world and dramatized the case. The IPCC chose this graph as its poster child to represent its findings, and climate change skeptics/deniers immediately started trying to tear it down.
Numerous websites and a few published articles made a variety of arguments against Mann's reconstructions, primarily
- they claimed that some specific tree ring data was shaky, and
- they disputed the methods used to combine temperatures from different sources.
Eventually a Congressional Hearing was held and Congress asked the National Academy of Science to look into the matter. What did the National Academy of Science say???
Mann et al.'s graph has been scrutinized from every possible angle. Yes, there are always mistakes and improvements, but the basic conclusions hold.
Another myth is that Mann et al.'s graph has been "pulled" or "replaced" in the IPCC report. This is not true -- instead, Mann et al. have been joined by a dozen or so new temperature reconstructions, sometimes called the Hockey "Team." These reconstructions use a variety of sources, proxies, and statistical techniques, but they all point in the same direction. Take a look -- each line represents a different published report, and MBH1999 is the granddaddy of them all -- good old Mann et al.
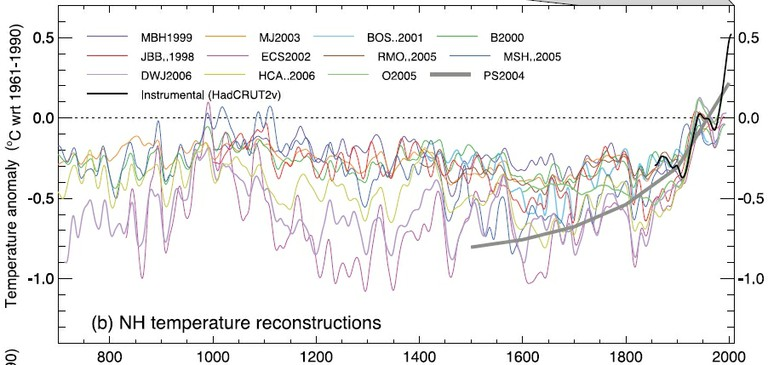
So... improved YES, wrong or gone NO.
Copyright University of Maryland, 2007
You may link to this site for educational purposes.
Please do not copy without permission
requests/questions/feedback email: mathbench@umd.edu