A warming world
So we had a few centuries of colder-than-average weather. Does that mean our current warm weather is just some sort of rebound effect?
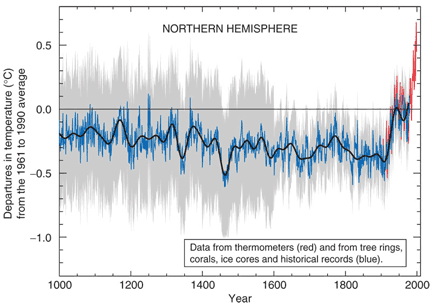
Look at the Mann graph again -- are the red temperatures representing the instrumental record a "return to normal?"
- yes: Really? Look how different the last 50 years are compared to the 950 years before them.
- no: Correct, temperature in the last 50 years shot up compared to the 950 years before them
- absolutely not: I couldn't agree more, temperature in the last 50 years is really unprecedented
So how much has temperature changed since about 1950?
1900-19501950-2000
overall change
Again, remember that may seem like a small change -- but we are talking about a half-the-world, year-round average, and just "normal" highs, not heat waves. Also remember that land mass heats up faster than water -- so while 2/3 of our planet is covered with water, the temperature change is focused on the 1/3 that we live on.
What does this graph predict about the future?
- Temperatures will go back to normal: Try again
- Temperatures will continue to rise: Try again
- That was a trick question: Yup, it was. This graph shows PAST OBSERVATIONS only. You know that because the x-axis stops at the year 2000.
Copyright University of Maryland, 2007
You may link to this site for educational purposes.
Please do not copy without permission
requests/questions/feedback email: mathbench@umd.edu