Know your colors

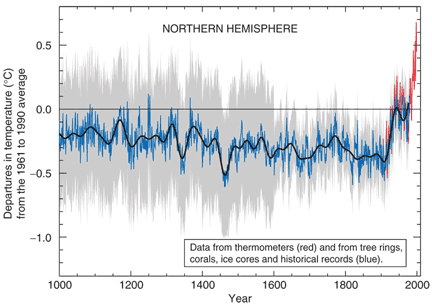
This graph includes a ton of information -- that's why 4 different colors are needed to keep the different data series separate. See if you can match the data series with its color:
Temperature estimations from years BEFORE the invention and standardization of thermometers
Temperature measurements from the years AFTER the standardization of thermometers
The variability (or uncertainty) around temperature measurements in any given year
A longer-term, smoothed out version of the yearly data.
Copyright University of Maryland, 2007
You may link to this site for educational purposes.
Please do not copy without permission
requests/questions/feedback email: mathbench@umd.edu