Page 3a: A short history of measuring temperature: look Ma, no thermometer
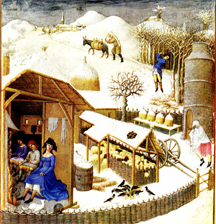 Throughout most of history, there were no thermometers to measure temperature. This graph starts in the year 1000 -- at this point in time, Europeans weren't even using soap, Muslim philosophers were exploring astronomy and medicine, and the Chinese were inventing gunpowder. Nobody was terribly concerned with measuring air temperature.
So, how do we know how warm or cold it was back then??? Well, the first thing to notice is that the gray area, which represents uncertainty (get it -- the gray area?) is much larger before the 1600s. Although there are ways of estimating temperature, they are not as exact as modern technology. Secondly, what scientists have done is to go back and look at how fast things grew -- this is a proxy for temperature. It is not a perfect fit, and hence the large gray area.
In order to do this, we need organisms that are long-lived and that show evidence of growth every year -- like trees. Give it a try, using the sample tree trunk below:
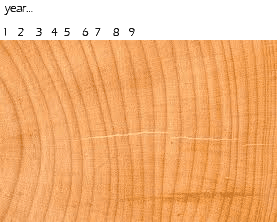 What were the 2 warmest years?
...and...
What was the coolest year?
Of course other factors are important as well. For example, a hot dry summer would probably result in little growth, and soil nutrients and pH would also affect growth. Clearly an entire temperature record based on one tree, or even trees worldwide, would be very shaky.
However, there are other long-lived organisms that we can use -- most importantly, coral. Since coral lives in the ocean, it would not be affected by rainfall on land, or by soil pH or nutrients. So, if the temperature record from trees matched up with the record from corals, it would provide much stronger estimates of world temperature.
Various other historical records can also provide evidence, including records of crop harvests and treelines. All of these different records provide "cross-validation" -- that is, because they largely agree with each other, we can have some level of confidence in these early temperature estimates, despite the large uncertainty that still surrounds them.
Page 3b: A short history of measuring temperature: thermometers
One of the early scientists to start developing a way of measuring temperature was Galileo Galilei. These devices were called "thermoscopes" because they did not actually have a scale which measured temperature. However, records from this time period do allow scientists to reconstruct world temperatures much more accurately.
Looking at the hockey-stick graph, when do you think thermoscopes were developed?
 Scientists very quickly decided to add a scale to their thermometers, but every scientist did it his own way. One used freezing and boiling points of water, another used freezing points of salt water and pure water, and still another made a scale where 0 degrees was ice melting and 12 degrees was human body temperature!
Eventually a German engineer named Fahrenheit, who was a thermometer manufacturer with a major market share, imposed his version on everyone else, and we got the Fahrenheit scale with 180 degrees between melting ice and boiling water. A few years later, a Swedish astronomer named Celsius proposed a different scale of 100 degrees, and we're still arguing about which scale is better. (Well, actually, scientists know that celsius is best, but Americans are a stubborn lot...)
Nevertheless, as thermometer manufacture became more standardized, the temperature estimates become less uncertain, and eventually only thermometer measurements are used -- the red data line.
Page 3c: The instrumental record
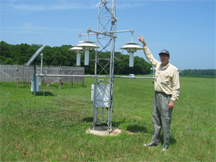
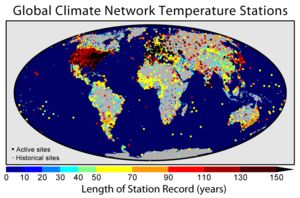 For temperature since about 1850, scientists can refer to the "instrumental record." This is a world wide record based on standardized thermometer readings from thousands of meteorological stations around the world.
Looking at the map above, where are the oldest stations?
- Africa: No, in fact large parts of the Sahara and of Southern Africa have very few stations. The small dots means the stations are no longer operating.
- US and Europe : Yes, the black dots in Europe and the eastern half of the US indication about 150 years worth of data
- The Pacific Ocean: No, most of the stations in the Pacific are coded yellow, meaning they go back only 50-70 years.
 Because there are now thousands of weather stations, the uncertainty in temperature measurements is now much lower than before 1850. But that doesn't mean it is simple to figure out the average world temperature! It turns out you can't just take a regular average -- instead, you need to account for the unevenness of the weather stations (lots in the US, few in Greenland or Africa, for example), urban heat island effects, and lots of other possible quirks.
In fact, computer software and advanced statistical techniques are needed to sort everything out, and as we'll see later, not everyone comes up with the same answer. However, the different answers do tend to be similar enough to all be telling the same story -- which we'll get to in the next page...
Copyright University of Maryland, 2007
You may link to this site for educational purposes.
Please do not copy without permission
requests/questions/feedback email: mathbench@umd.edu