Iterating the discrete curve
We compared the shape of the curves given by the two models. Solving the continuous model here is beyond the scope of this module (that would get into a lot of calculus), but we can do the discrete model with a modest amount of algebra.
Let's go back to sugar water, with the following assumptions:
- Initial concentration on left = 1 M
- Initial concentration on right = 0 M
- P = 0.1 cm/sec
- A = 1 cm2
- equal volumes on both sides of membrane
We want to know what the final concentrations will be over time , i.e., at time 1 sec, 2 sec, 3 sec, 4 sec....... So let's set up our equation from above. We know that :
Δn/Δt = 0.1 cm/sec x 1 cm2 x (1 M − 0 M) = 0.1 moles/sec
In the first second, approximately 0.1 moles change sides (from the more concentrated to the less concentrated side). That leaves
on the left side: 1 mole - 0.1 moles= 0.9 moles/litre
on the right side: 0 moles + 0.1 moles= 0.1 moles/litre
How about the concentrations at time 2 seconds? We need to readjust our estimate of diffusion rate by plugging in the new concentrations. Everything else stays the same:
Δn/Δt = 0.1 cm/sec x 1 cm2 x (.9 M - .1 M) = .08 moles/sec
and the new concentrations are 0.82 M and 0.18 M.
on the left side: 0.9 moles - 0.08 moles= 0.82 moles/litre
on the right side: 0.1 moles + 0.08 moles= 0.18 moles/litre
Continuing on like this,
Δn/Δt t at 3 seconds = 0.074 moles/sec,
C on left = 0.746 M, C on right = 0.254 MΔn/Δt t at 4 seconds = 0.049 moles/sec,
C on left = 0.697 M, C on right = 0.303 MΔn/Δt t at 5 seconds = 0.039 moles/sec,
C on left = 0.658 M, C on right = 0.342 MΔn/Δt t at 6 seconds = 0.032 moles/sec,
C on left = 0.626 M, C on right = 0.374 M
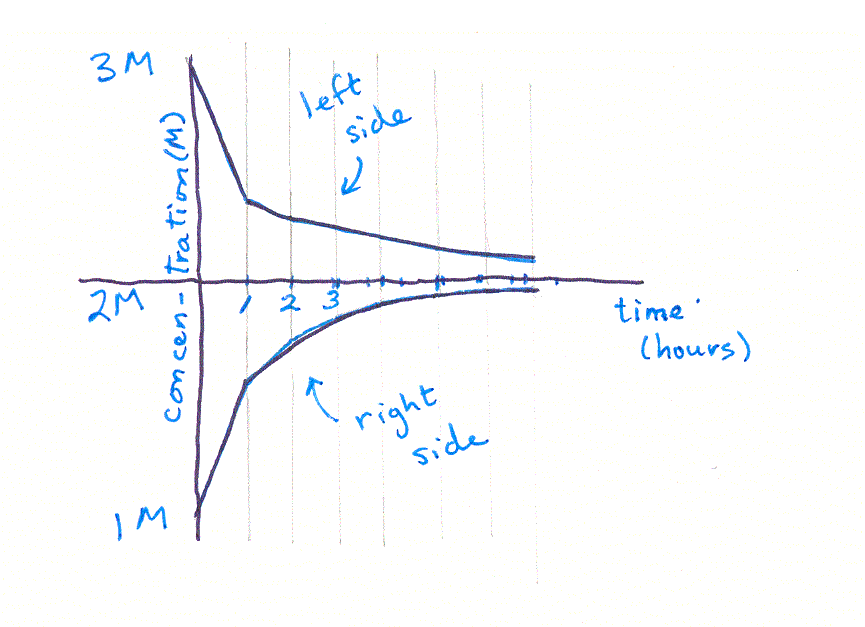
This process is called "iteration" -- you iterate, or repeat, the equation over and over, each time substituting in the values calculated in the last iteration. You can see that, if we continued iterating long enough, we would eventually reach a point where the two concentrations were equal -- in other words, an equilibrium. (It would take a long time though, better use a spreadsheet rather than a calculator!) If you graph the two sets of concentrations, you'll see something like this:

Copyright University of Maryland, 2007
You may link to this site for educational purposes.
Please do not copy without permission
requests/questions/feedback email: mathbench@umd.edu
