Graphing bigger (and smaller) numbers
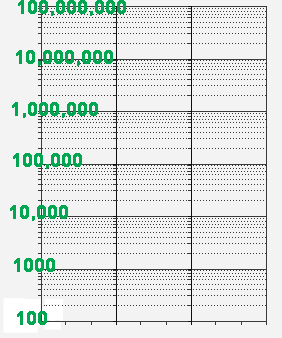
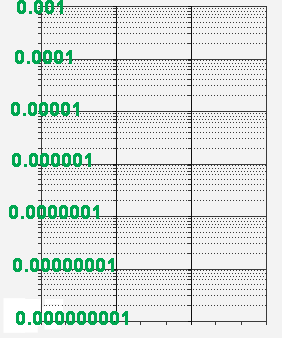
You can stack several cycles to get paper that spans several orders of magnitude (every time you multiply by 10, you get 1 order of magnitude). Here are two possibilities.

|
 |
How many cycles?
How many cycles would you need to represent the following data:
| year | 1990 | 1991 | 1992 | 1993 | 1994 | 1995 | 1996 | 1997 | 1998 |
| popn. size | 3 | 17 | 190 | 2871 | 6743 | 34 | 590 | 4282 | 28,475 |
(To make this problem interactive, turn on javascript!)
- I need a hint ... : What are the min and max measurements?
- ...another hint ... : The min and max are 3 and 28,475?
- ...another hint ... : The data span 5 orders of magnitude (1-digit to 5-digits).
I think I have the answer: 5 cycles, starting at "1".
How many cycles would you need to represent the following data:
| day | 1 | 2 | 3 | 4 | 5 | 6 | 7 | 8 | 9 |
| cell size (um) | 0.003 | 0.017 | 0.290 | 0.2871 | 6.743 | 34.0 | 0.590 | 0.04282 | 3.8475 |
(To make this problem interactive, turn on javascript!)
- I need a hint ... : What are the min and max measurements?
(Be careful -- don't assume the max is in the last day).
- ...another hint ... : The min and max are 0.003 and 34.0.
- ...another hint ... :The smallest cycle must start with 0.001 . The largest cycle must start with 10.0.
I think I have the answer: 5 cycles, starting at "0.001".
Copyright University of Maryland, 2007
You may link to this site for educational purposes.
Please do not copy without permission
requests/questions/feedback email: mathbench@umd.edu