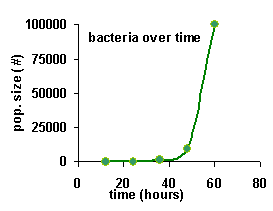
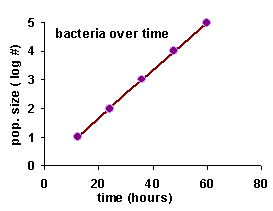
The curvy line turned into a straight line!
You probably noticed the curvy line on the original graph turned into a straight line on the log transformed graph.
 |
 |
|---|
Why does this happen? Consider the following 2 facts:
1. In real life, every time 12 hours passes, the bacteria increase by a factor of 10.
2. In math life, every time you move up a log unit, you're increasing the magnitude of the original measurement by a factor of 10.
So, taking the log accounts for the multiplying nature of bacterial growth, and all you're left with on the graph is a straight line, pointing upwards.
 When growth happens by multiplying the population by a constant number each timestep, we call that
exponential growth. And any time you have exponential growth, taking the log of the population size will turn
the graph into a straight line. This is true even if the constant multiplier is not 10 -- in that case, your straight line will
have a different slope, but it will still be straight.
Copyright University of Maryland, 2007
You may link to this site for educational purposes.
Please do not copy without permission
requests/questions/feedback email: mathbench@umd.edu