One small correction
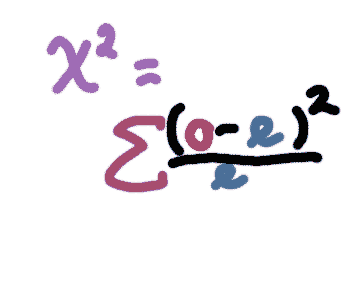
The method I showed you on the last page was not quite right. For reasons that are difficult to explain without a degree in statistics, you need to SQUARE the raw deviation before dividing by the expected value. So we have the following sequence:
If the final chi-squared statistic is a big number, would this make you think that the data fits the model, or does not fit the model?
(To make this problem interactive, turn on javascript!)
- I need a hint ... : A big chi-square statistic probably means that the individual
numbers you added were also big...
- ...another hint ... : The individual numbers you added were deviations from
the model predictions.
I think I have the answer: Since the individual numbers you added
were deviations from the model predictions, a big chi-squared statistic means
that the data deviate a lot. In other words, the model is a bad fit.
Copyright University of Maryland, 2007
You may link to this site for educational purposes.
Please do not copy without permission
requests/questions/feedback email: mathbench@umd.edu
 Determine what you “expected” to see.
