The whole beast
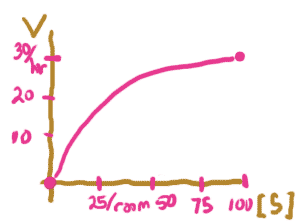
This simple graph, as it turns out, actually does correspond to the simplest enzyme kinetic process. I added some more labels: the highest goop production rate is now Vmax, and I put some (hypothetical) numbers on the axes.
Before going on to think about what equation might cause this graph,
think about some questions that you can answer using the graph alone.
How many bags do I have to put out to get only 10% of Vmax?
(To make this problem interactive, turn on javascript!)
- I need a hint ... : 10% of Vmax is 3 bags/hr
- I need a hint ... : Read it off the graph!
I think I have the answer: about 10 bags/room
If I put out 20 bags per cubic meter, what rate of production will I get?
(To make this problem interactive, turn on javascript!)
- I need a hint ... : Read it off the graph!
I think I have the answer: about 12 bags/hr
Those were pretty easy. Here is a more conceptual question: If I double the number of bags of chocolate chips, do I double the rate of goop production? Put your mouse over each graph below to see whether this is true:
|
|
||
|
|---|

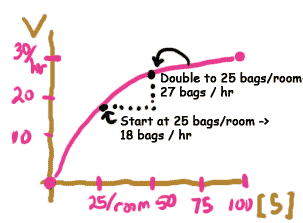
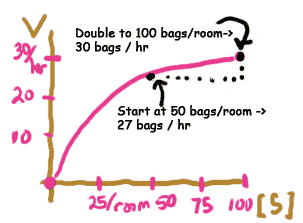
So, sometimes I do double production, but sometimes production is less-than-doubled, and sometimes it is more-than-doubled.
You should remember that "if x doubles, then y doubles" is characteristic of only one particular kind of graph -- a linear function that goes through zero. This graph is not linear! In fact, enzyme kinetics is an examples of a NONLINEAR process.
Copyright University of Maryland, 2007
You may link to this site for educational purposes.
Please do not copy without permission
requests/questions/feedback email: mathbench@umd.edu