The middle of the beast.
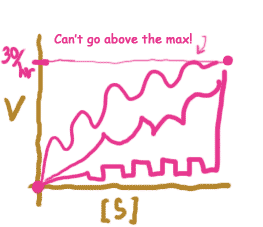
Now I know what the head and the tale of this particular graph should look like. How about the middle? Do you think the line might be able to go up and down? In other words, as the amount of substrate (bags of chocolate chips) increases, will the rate of product formation (piles of goop) always increase, or will it sometimes increase and sometimes decrease?
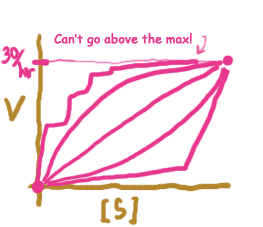
| various functions that go up and down | various functions that only go up |
|---|---|
 |
 |
I think it's reasonable to assume that the more bags of chocolate chips there are, the easier it is for the enzyme to find the next bag, and therefore the rate of reproduction will increase continually. In mathematical terms, we would say that the graphic increases monotonically. (It is possible to think of circumstances in which this would not be true, but they would be very special circumstances).
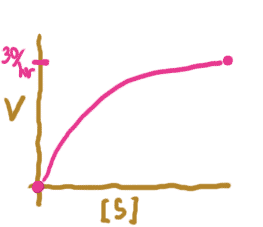
Of course, there are still many ways that a graph could increase on monotonically between zero and some maximum level, as shown above. Without doing some experimentation, it's hard to choose the most likely graph. However, consider the following: f you compare no substrate to a little bit of substrate, you might expect a rapid rise in goop production rates. If you compare a little substrate to more substrate, you still get a rise into production rates, but not quite as much of a rise. And if you compare a lot of substrate to a really really lot of substrate, you don't get much of a rise at all. What graph would fit this description? Sketch it first, then click the button below:
button

Copyright University of Maryland, 2007
You may link to this site for educational purposes.
Please do not copy without permission
requests/questions/feedback email: mathbench@umd.edu