Let's ask the computer to do more...
For a person clicking on a button and writing down results, 10 or 20 trials is a lot. For a computer to run 10 or 20 trials and keep track of the results requires about a millisecond of processor time.
So let's ask the computer to do more. 100 trials? 1000 trials? Sure, no problem.
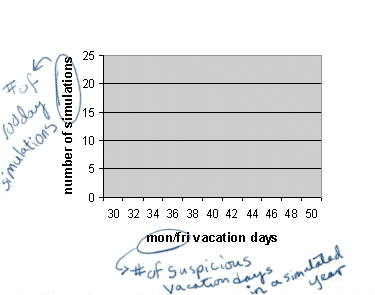
In the applet below, when you click the "Simulate 1 year" button, the computer will run 1 trial of 100 sickdays (i.e., one sick-year), count how many fell on Monday or Friday, and put a bar on the chart in the appropriate spot.
First, simulate a "year" worth of sickdays. How many M/F sickdays were there? Keep going a year at a time until the "100 years" button lights up. Click the "100 years" button. What is the average # of M/F sickdays? |
Do the results in the applet support or reject Dilbert's hypothesis (that sickdays are random)?
(To make this problem interactive, turn on javascript!)
- I need a hint ... : Look at your histogram -- does it appear that 42 sickdays
happens in at least 5% of the trials?
- ...another hint ... : If you simulated 100 trials, then 5% means 5 trials.
So if you count the 5 highest sickdays, you know where the actual 5% threshhold
is (probably somewhere around 50+ Mon/Fri sickdays per year).
I think I have the answer: Most of the time when you run this applet,
AT LEAST a third of the trials have 42 or more mon/fri sickdays,
which makes it very common -- this supports the null hypothesis,
which was that the data fit a random model.
Copyright University of Maryland, 2007
You may link to this site for educational purposes.
Please do not copy without permission
requests/questions/feedback email: mathbench@umd.edu
