Slope = rate
Here's another graph:
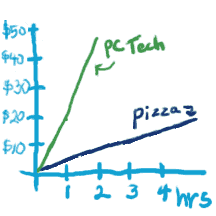
Looking at the graphs, can you figure out how much each person makes per hour? In other words, what the change in money per time is?
|
You may recognize "change in money per time" as being basically the same as delta y / delta x, which is the classic formula for slope. This is no accident.

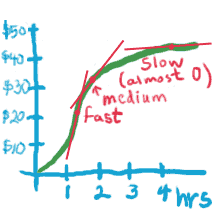
If you can engrave this on your brain, you'll have a head start interpreting lots of graphs, whether they are straight lines or not. The slope at any part of a graph tells you how fast the process is happening right then.
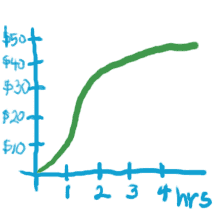 This graph represents sales of pizza slices over a period of 4 hours. At what point in time is pizza income increasing at the fastest rate?
(To make this problem interactive, turn on javascript!)
- I need a hint ... : Slope = Rate
- ...another hint ... : Where is the slope the steepest?
I think I have the answer: At about the 1.5 hour mark.
To make this element interactive, turn on javascript.
Click the buttons to see how slope and rate are related:
|
 |
_in_Computer_Repair_aboard_the_amphibious_assault_ship_USS_Kearsarge_(LHD_3).jpg)
Copyright University of Maryland, 2007
You may link to this site for educational purposes.
Please do not copy without permission
requests/questions/feedback email: mathbench@umd.edu