Rates of change
I'm not going to start this mini-module by talking about spectrophotometers (just try to say it 10 times fast), but instead by talking about a certain kind of a mathematical relationship: DIRECT PROPORTIONALITY. I am sure you have encountered this lots of times in your math classes, but in my experience, most people don't make the connections to really understand how direct proportionality and measurement are connected. So, bear with me for a bit...
Directly proportional, as you probably remember from math class, means that as one thing increases, the other increases by the same proportion. Think about your favorite hourly wage job (in my case, this was topping pizzas at minimum wage):

• If I work twice as many hours in a week, my paycheck is twice as much.
• If I get sick and work only 75% of the time, I get 75% of the money.
• If I don't work at all, I don't get any money.
Directly proportional is what little kids think of as "fair". It wouldn't be "fair" to work double the hours but make only 10% more! And, while it would be nice to work 75% of the hours but still make 100% of the paycheck, I guess that wouldn't be "fair" either.
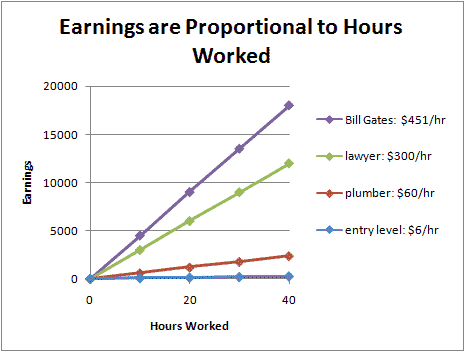
Relationships that are directly proportional can be shown on a graph as a straight line that goes through (0,0) — if I don't work at all, I don't get any money. And they look like a straight line — for each extra hour I work, I make the same amount of money. But other than that, the graphs can look quite different. Look at the graphs below to see the difference between several professions:

In all cases, our pay is directly proportional to our work hours — double the hours, double the pay. But some people are accumulating money a lot faster than other people. That is reflected in the steeper slope of some lines (like Bill's, based on his 2004 salary and excluding his stock options).
Copyright University of Maryland, 2007
You may link to this site for educational purposes.
Please do not copy without permission
requests/questions/feedback email: mathbench@umd.edu