Time-to-diffuse "explodes"
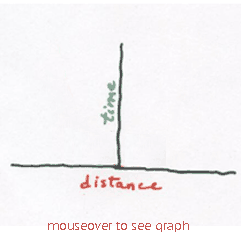
How does a graph of time to diffuse as a function of distance look? In other words,
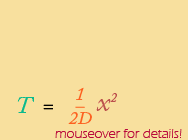
1. Use the equation T = x2 / 2D
2. put distance (x) on the x-axis
3. put time (T) on the y-axis
4. assume D = 0.00001 cm2/sec
So, what does the graph look like? Remember, that T = x2 / 2D is a quadratic equation, equivalent to y = ax2 and so takes the shape of a parabola. In this case, the constant “a” is represented by the term 1/2D. Here is the graph, using D = 0.00001.
 |
 |
Notice that as the distance increases a little, time increases a lot. We say that:
- “time to diffuse increases with the square of distance”, or equivalently,
- “distance diffused increases with the square root of time”.
Copyright University of Maryland, 2007
You may link to this site for educational purposes.
Please do not copy without permission
requests/questions/feedback email: mathbench@umd.edu