>Episode 2: Hardy and Weinberg to the rescue
What stories a graph can tell.
|
"I had a grandmother with blue hair," remarked the OA moodily. The Assistant pushed on, "In fact, even if you could find a legal way to get all the blue-haired people to segregate themselves, as soon as that restriction was taken away and pairing off reasonably randomly, the equilibrium proportions would return within ONE SINGLE GENERATION." "How can that be?" "Because every generation of random mating is like taking ALL the alleles and throwing them in a blender. They all get paired up randomly - and that means the equilibrium proportions are right back again, like magic. Like pulling a rabbit out of a hat. "You mean like pulling a random hare out of a hat." "Well, yes," the Assistant admitted. "It all depends on random assortative mating..." "Kinky," said the OA. The Assistant rolled his eyes. "It just means that love is blind... to hair color anyway. It would mean that people with blue hair are not biased towards other people with blue hair - or against them either." "But love isn't blind. Tall people marry tall people, for example." "True, but I didn't say love had to be completely blind. Just blind to that particular trait, hair color." |
Proportions of heterozygotes
(To make this problem interactive, turn on javascript!)
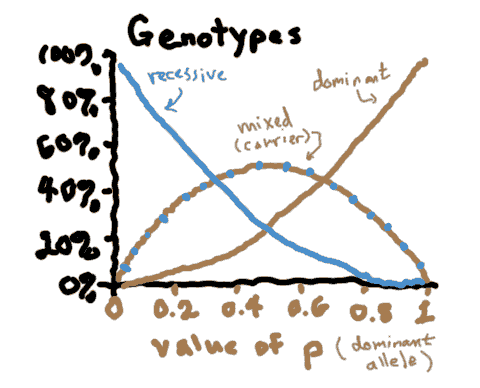
Looking at the graph below, what is the range of possible proportions for carriers in a randomly mating population?
- I need a hint ... : What is the highest level of heterozygotes possible under H-W equilibrium
- ...another hint ... :Is it possible that ALL members of a population are heterozygotic?
I think I have the answer: 0-50%

When are carriers most common?
(To make this problem interactive, turn on javascript!)
Looking at the graph above, under what conditions are carriers most common?
- I need a hint ... : Under what conditions is the line for carriers above the lines for homozygotes?
I think I have the answer: p = .33 to .66
Copyright University of Maryland, 2007
You may link to this site for educational purposes.
Please do not copy without permission
requests/questions/feedback email: admin@mathbench.umd.edu