Interpreting the chi-square test
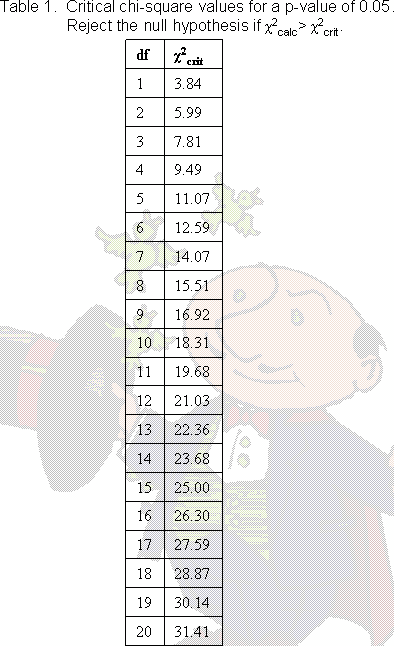
So, once you know the degrees of freedom (or df), you can use a chi square table like the one on the right to show you the chi-square-crit corresponding to a p-value of 0.05. That's the whole detour summed up in one sentence. Whew. For the workweek test, with 1 df , the chi-square-crit is 3.84, whereas his chi-square-calc was 0.167. What does critical value mean?
|
 |
Why do you think the chi-square-crit increases as the degrees of freedom increases?
(To make this problem interactive, turn on javascript!)
- I need a hint ... : If you have, say, 15 degrees of freedom,
how many rows are in your table?
- ...another hint ... : For every row in the table you need to calculate another deviation.
I think I have the answer: With a lot of degrees of freedom,
you have a lot of rows in your table. Therefore you're adding
more numbers together to get your final chi-square.
So it makes sense that the critical value also increases.
Fine print: some chi-square lookup tables have many columns, one for each p-value you might be interested in. In that case, you first need to find the 0.05 p-value (or any other p-value you're asked for), then the df, then the chi-square-crit.
Even finer print: or, you may be asked to find the p-value corresponding to the chi-square-calc. In that case you have to find the right df first, then find the two chi-square-crits that your chi-square-calc falls between, then note the p-value.
Copyright University of Maryland, 2007
You may link to this site for educational purposes.
Please do not copy without permission
requests/questions/feedback email: mathbench@umd.edu