 |
 |
Digging even deeper
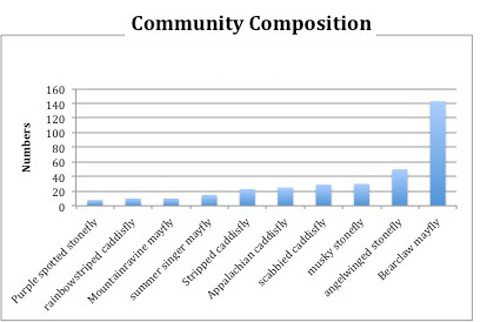
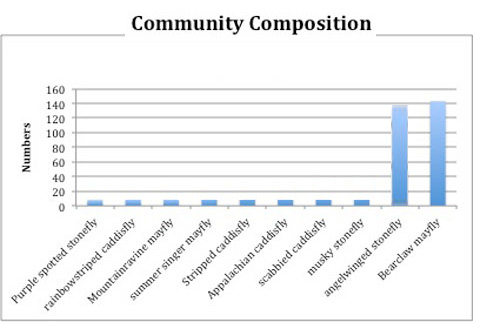
Species richness and %dominance are very simple measures. It would be nice if there was a score that somehow summarize the shape of the whole graph. We could imagine communities that are not at all alike, but have the same richness and dominance -- like the ones on the right (roll over the images to see the %dominance).
So what to do? As a starting point, we could figure out the percentage of each species in the community. But how can we summarize this into a single index?
If we just add all the percentages, we will always come out to 100% . What we need is a way to combine the percentages that reflects something about both the number of species and the how common each species is.
Let's do some experimenting with a really simple community -- just 3 kinds of insects, conveniently named Bugs A, B, and C:
Pristine stream: 50% Bug A, 25% Bug B, 25% Bug C
Polluted stream: 50% Bug A, 49% Bug B, 1% Bug C
Which of these 2 communities has greather %dominance?
How to think about squaring a percentage:
When you square a percentage between 0 and 1, you ALWAYS get a number smaller than what you started with. Why? Think of the decimal as a fraction
25% = 1/4.
So squaring the fraction is the same as saying "one-fourth of one-fourth" -- clearly smaller than the original one-fourth.
And, even better, as the original fraction gets smaller, the squared fraction gets TINY. One-tenth of one-tenth is pretty small, and one-hundredth of one-hundredth is really tiny.
So, how can we distinguist between these communities without listing out all the species percentages??? We can't just add them (because we'll always get 1.0) ... but if we square each percentage FIRST, then add, we'll get some number less than.
Let's give it a try. For the pristine stream, we have:
.502 + .252 + .252 =
.25 + 0.0625 + 0.0625 =
0.375
We'll call this Simpson's Dominance. Now you try the the polluted stream:
There are 3 species in the polluted stream: 50% Bug A, 49% Bug B, and 1% Bug C. What is the Simpson's dominance index
(To make this problem interactive, turn on javascript!)
- Starting with Bug A ... : 0.50 squared is 0.25
- ...about Bug B... : 0.49 squared is 0.24
- ...about Bug C... : 0.01 squared is 0.0001
- ...adding them up... : 0.25 + 0.24 +0.0001 = ...
I think I have the answer: 0.4901
Copyright University of Maryland, 2007
You may link to this site for educational purposes.
Please do not copy without permission
requests/questions/feedback email: mathbench@umd.edu