Keeling Curve at 3 (years old)
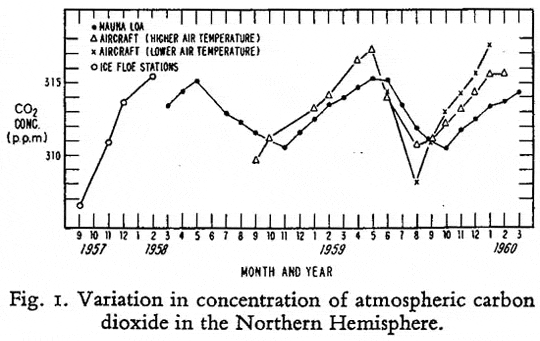
Here is the original Keeling curve, as published by Charles D. Keeling in 1960 in a journal called Tellus:

We can see the yearly cycle of carbon (lowest in November, highest in May) quite clearly. The "small but persistent increase" on a year by year basis is much harder to see. In fact, a lesser scientist would probably have ignored the increase. A less extensive and less careful set of measurements would have obscured it. But, here are the numbers, as published in the same paper:
| March 1958 | March 1959 | March 1960 |
|---|---|---|
| 313.4 ppm | 314.0 ppm | 314.4 ppm |
The same pattern happened for most of the months in the dataset.
Remember that Keeling called the increase "small but persistent". I think we can all agree that .4 parts per million is pretty small! Over 50 years, that rate would have lead to an increase of (only) 20 parts per million... In fact, in the next 50 years, CO2 levels increased by about 70 ppm, showing that the "small but persistent" increase has become not-so-small but just as persistent.
And the idea that human-caused emissions were dwarfed by natural flows? In one sense, that's true. Plants and bacteria cycle over 10 times more CO2 than humans, but those cycles are BALANCED, while humans ONLY EMIT CO2, but do not take it back up. Think about it this way: if your earn $1000 a month  and you spend exactly the same amount every month, your bank account will stay the same from month to month, right? But if you decide to spend an extra $50 per month at a tanning salon, you will steadily go into debt. It doesn't matter that the $50 for tanning is small compared to your monthly income: what matters is that you are out of balance.
Tanning: bad for you, bad for the earth!
Copyright University of Maryland, 2007
You may link to this site for educational purposes.
Please do not copy without permission
requests/questions/feedback email: mathbench@umd.edu