Method 2: graph, then log.
 In the first method, you transform first, then graph. In the second method, you graph first -- then
let the graph paper do all the hard work. You just have to use a special graph paper with a log scale.
There are two kinds of log graph paper.
• Semi-log paper as a log scale only on the y-axis.
• Log-log paper has a log scale on both the x and the y-axes.
In the example we've been using so far, we want to take the log of the data on the y-axis, but the data on x-axis is fine the way it is. Therefore, we want to use semi-log paper.
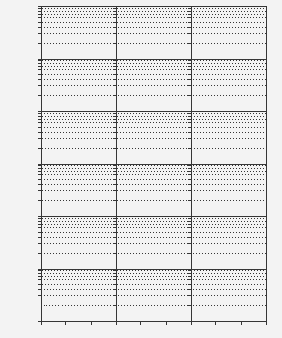
Semi-log paper is a little mysterious at first. Here is a small piece:

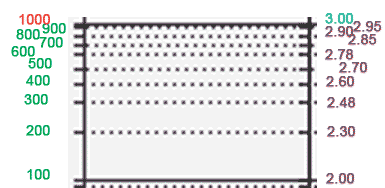
This is called a "cycle" and in this case it goes from 100 to 1000. The cycle is always divided into 10 pieces, as shown on the left (100 - 200 - 300 - 400 ... ). I'm sure you've noticed that the lines get closer together at the top of the cycle -- that's because the numbers are arranged on a log scale . The number half-way between 100 and 1000 is NOT 550, as on an ordinary scale, but rather (approximately) 300.
On the right, I'm showing you how the measurements on the left correspond to their logged values on the right -- normally these purple numbers are NOT written on the graph. However, I'm doing it so that you can see that the LOGGED numbers proceed in an orderly fashion, with 2.48 being just about in the middle between 2 and 3.
To plot a number like 420, you have to
• count up by hundreds to get to 400, then
• fudge a little to get 420.
On the applet below, you need to find the y-values on semi-log paper. The first one is 420, just to make things easy.
(You don't have to get the point in exactly the right spot, but you do need to put it pretty close. Also, I apologize, but I can't seem to make the applet say "you're done" when you're done -- you'll be able to tell there are no new points coming...)
Copyright University of Maryland, 2007
You may link to this site for educational purposes.
Please do not copy without permission
requests/questions/feedback email: mathbench@umd.edu