Choose your x and y carefully.
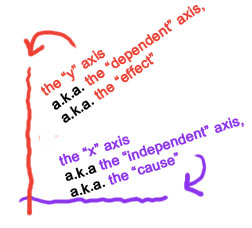
Scientists like to say that the "independent" variable goes on the x-axis (the bottom, horizontal one) and the "dependent" variable goes on the y-axis (the left side, vertical one). This does not mean that the x variable is out partying while the y variable is whining about the x variable never being around -- that's co-dependence, which is a completely different kettle of fish.
When you're talking about variables, "independent" means that the researcher (you, or someone else in a white coat) can pick any value they want for that variable. Using the TV viewing distance data, you can imagine the researcher putting little pieces of tape on the floor and positioning her small experimental subjects at just the right distance ... whereas I can't think of any way the researcher can directly control how much eyesight the kids lost.
Personally, I still mix up right and left, and I find the words "dependent" and "independent" a little confusing. So I think "cause" (the x variable) and "effect" (the y variable). This is not exactly right and will make some scientists apoplectic, but as a sort of memory aid, it might help you too. So,
• The cause is how far the kid sits from the TV - the x variable
• The effect is how much eyesight she loses - the y variable.
OK, now you try: for each pair, what is "x" and which is "y"?
 Choose your x and y carefully...
To make this interactive, turn on javascript!
Type "x" for the data that should go on the x axis, "y" for the y-axis data, and "n" if the data should NOT be used in a graph.
number of surviving fish in tank
water temperature in tank
Answers: y, x
 Choose your x and y carefully...
To make this interactive, turn on javascript!
Type "x" and "y" again...
grams of food fed per day
daily growth rate of mouse
Answers: x, y
OK, those two were easy. In both cases, the x variables (temperature of tank or amount of food given) are easily controlled by the experimenter. Sometimes the "x" variable can't actually be controlled but only "chosen" by researcher -- this is especially the case when some version of "time" is the x variable.
However, be careful. Just because a variable includes time does not mean that it is automatically the x variable. Sometimes the amount of time a process takes is the EFFECT of a treatment, and then its the "y" variable.
 Choose your x and y carefully...
To make this interactive, turn on javascript!
Type "x" and "y" again...
year
deer population size
Answers: x, y
 Choose your x and y carefully...
To make this interactive, turn on javascript!
Type "x" and "y" again...
time until total pain relief
dosage of Dilaudin (an opiate painkiller)
Answers: y, x
Did you get the Dilaudin example? In this case, the researcher is trying to find out how long it takes to get pain relief DEPENDING ON how much medication is given. The researcher can directly control (or choose) dosage, but not time.
Finally, data tables often contain many columns, so it's important to figure out which ones belong on a graph. Below, type "n" for data that will NOT be represented by either "x" or "y".
 Choose your x and y carefully...
To make this interactive, turn on javascript!
Type "x" and "y" again... and "n" for data that should NOT be used in a graph.
embryo identification number
size of embryo
time since conception
Answers: n, y, x
 Choose your x and y carefully...
To make this interactive, turn on javascript!
Type "x" and "y" again... and "n" for data that should NOT be used in a graph.
number of hours studied for the test
student id number
teacher social security number
percent correct on test
Answers: x, n, n, y
Copyright University of Maryland, 2007
You may link to this site for educational purposes.
Please do not copy without permission
requests/questions/feedback email: mathbench@umd.edu