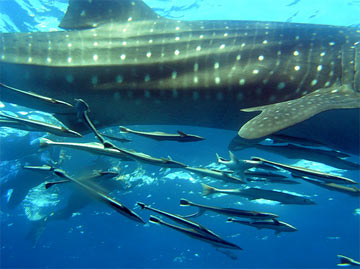
Testing Fish2Whale
Recall that, after an angry exchange of emails, the winning procedure for testing Fish2Whale fishfood was:
- Feed normal fish food to one group of fish (the control group) and
- Feed Fish2Whale to another group of fish (the treatment group) and
- See which group grows longer in length.
 Here is the data your lab got:
Control group mean length 22 cm, SD 3 cm
Treatment group mean length 25 cm, SD 3 cm
What percentage of the control group fish are between 22 and 25 cm?
(To make this problem interactive, turn on javascript!)
- I need a hint ... : Remember that 68% of a normal population falls between plus and minus 1 SD.
- ...another hint ... : The control group mean plus 1 SD = 22+3 = 25
- ...another hint ... : This is the same as asking what percentage of the population
is between the mean and the mean + 1 SD.
- ...another hint ... : A normal distribution is symmetrical.
I think I have the answer: 34% (half of 68%, since 22 to 25 is the same as the mean and the mean + 1 SD)
What percentage of the treatment group fish are between 22 and 25 cm?
(To make this problem interactive, turn on javascript!)
- I need a hint ... : This is the same as asking what percentage of the population is between the mean and the mean + 1 SD.
I think I have the answer: 34%
(The numbers worked out quite easily here since I chose exactly the mean and the mean plus 1 SD as the range of interest. However, there are tables which allow you to make the same calculation for any range you're interested in. We won't cover them here.)
Copyright University of Maryland, 2007
You may link to this site for educational purposes.
Please do not copy without permission
requests/questions/feedback email: mathbench@umd.edu