More about normal distributions
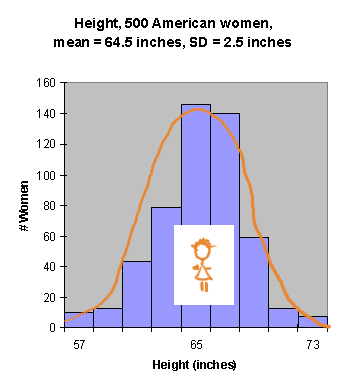
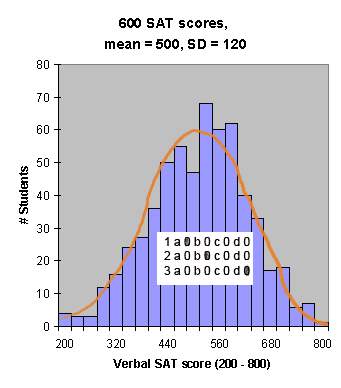
And here are some specific (and real) normal distributions:
 |
 |
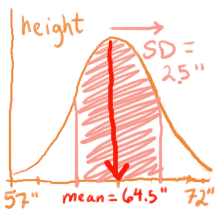
Adult height is affected by a variety of factors:
|
SAT scores are affected by a variety of factors:
|
An ideal, or theoretical, normal distribution is symmetrical and shaped a bit like a bell (its also called a Bell Curve). Or course your data will never follow an ideal normal distribution exactly, but many datasets do approximate a normal distribution. An amazing fact is that IDEAL normal distributions can be described by 2 parameters ("parameter" being a fancy word for "number"). These two parameters are:
- Where the distribution is centered (the value at the peak. This is called the mean).
- How wide the distribution is (how much variability there is in the thing you're measuring).
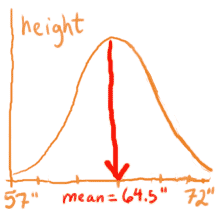
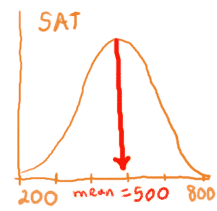
How to measure the mean is pretty straightforward: just find the peak, drop a line down to the x-axis, and that's your mean. Here are the 2 distributions from above:
 |
 |
It's harder to measure how wide the distribution is. Very big or very small fish, people, and SAT scores do occur, at least with a small probability (like one-in-a-million). So instead of measuring the entire width, we measure the middle two-thirds (actually the middle 68%, for mathematical reasons). This is called the Standard Deviation, or SD. Again, the distributions from above:
 |
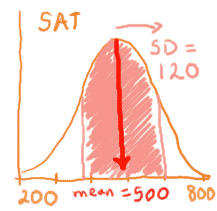 |
So, ~68% of the observations fall between plus and minus 1 SD. Another way of saying this is that if you measure plus and minus 1 SD from the mean, you will shade 68% of the area under the curve. Most of us are not very good at eye-balling 68% of a curvy shape, and there is a mathematical formula for determining the standard deviation. If you already know it, good for you. If not, we'll discuss it later. For now, just remember that the standard deviation (SD) measures how far you have to go FROM THE MEAN along the x-axis to encompass 68% of the population. In other words, the SD measures how variable the population is.
Copyright University of Maryland, 2007
You may link to this site for educational purposes.
Please do not copy without permission
requests/questions/feedback email: mathbench@umd.edu