How to determine e, the long version....
Recall that the extinction coefficient tells you how much light is absorbed by each bit of gunk: OD = e c. What kind of ‘gunk' you have determines what “e” is. Fish tank gunk is different from the food dye in lime coolaid, which is different from the green-tinged anti-freeze. The only way to find out the value of “e” is to measure it.
So how to measure e? Remember how you can look at a graph and determine the slope? That's how you figure out what e is. You simply make a graph of absorbance vs. concentration, then you look at the graph and figure out the slope.
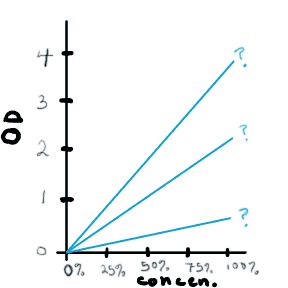
You need a graph that looks like one of these:

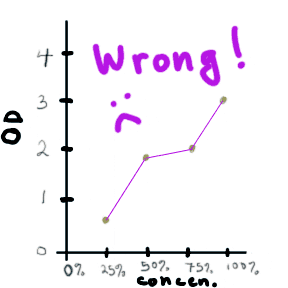
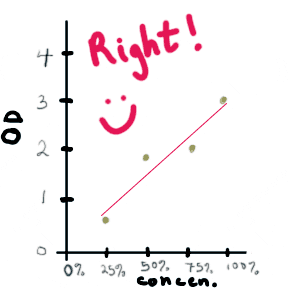
You can make this graph by measuring absorbance for solutions with a few different concentrations. Then you need to draw a line through the dots. Now, when I say "draw a line through the dots", please DON'T think this means simply connecting the dots as if you were doing a dot-to-dot puzzle. Instead, you want a single straight line that goes approximately though the center of your group of dots, so some dots are above and some are below the line, but all are as close as possible. (In statistical circles, this is known as "doing a linear regression," and there are mathematical ways of ensuring you have the closest fit, but this is NOT required in this module.)
 |
 |
So let's say you want to find out what "e" is for Beer. (Incidentally, I am not the first one to come up with this brilliant idea. The magazine "Brewing Techniques" published a long, controversial, and apparently quite serious series of articles on this back in the mid 1990's. Maybe the idea is to use a spec to figure out when the beer is "done". According to the articles, some people don't believe that beer actually follows Beer's Law — how's that for irony?)
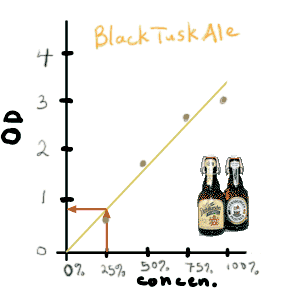
Back to finding out "e" for beer. You would take a sample of beer, dilute it to 25%, run it through the spec, and mark your data point on the graph. Then you need to do the same with a 50% sample, a 75% sample, and a 100% sample. According to Brewing Techniques, for Black Tusk Ale, you then get a graph that looks like this:

| If you turn on javascript, this becomes a rollover |
Now that we have a graph, we can find the extinction coefficient "e" — which is the same as the slope of the line :

| If you turn on javascript, this becomes a rollover |
So, for every 25% change in concentration, OD increases by about 0.8 units. The slope of the line is 0.8 / 25, or 0.032, which is also the value of "e", the extinction coefficient. For Black Tusk Ale, Beer's Law is OD = 0.032*c.
Copyright University of Maryland, 2007
You may link to this site for educational purposes.
Please do not copy without permission
requests/questions/feedback email: mathbench@umd.edu