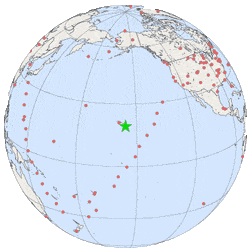
Lets go to Hawaii
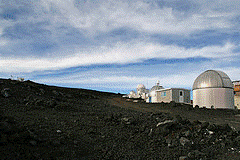
At this point, Keeling started to get more amibitious. He knew he needed to get far away from cars and smokestacks that might make his data wonky. What better place than Mauna Loa Hawaii, in the middle of the Pacific Ocean?
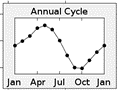 After 2 years of data from Mauna Loa, he was ready to publish his first big paper. He showed two major trends. First, CO2 levels plunge during the spring/summer growing season, as plants pull more CO2 out of the atmosphere to fuel their growth. Once trees begin to lose their leaves, and annual plants die off in the fall, CO2 is released back into the atmosphere, CO2 levels go back up. This yearly cycle in itself was a pretty cool result that no one had measured before.
But even more surprising, he found out what was happening to all the carbon dioxide being released through burning coal and gasoline..
Back then, nobody knew.
Maybe it degraded on its own?
Maybe it got taken up by plants?
Maybe it sank into the ocean?
 Furthermore, most scientists doubted that emissions from burning coal and gasoline would even be very important. They figured that the natural carbon dioxide flows would dwarf whatever humans were doing.
But Keeling found out what happened to the extra carbon dioxide... it just stuck around. CO2 accumulated in the atmosphere. He called it a "small but persistent increase". So from one year to the next, the amount of CO2 increased. This seems obvious to us now, but back then it was a HUGE discovery.
Copyright University of Maryland, 2007
You may link to this site for educational purposes.
Please do not copy without permission
requests/questions/feedback email: mathbench@umd.edu