Visualizing the growth equation
Rather than show you a graph of population size, see if you can use your mouse to draw an exponential curve (specifically, starting at 1 and doubling at each timestep) on the graph below.
Then click on the "Check" button to see how close you got.
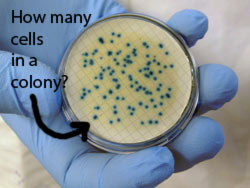
Graphs of exponential growth always curve upwards, like this one. Now see if you can figure out approximately how many cells are in the little "pile", or colony, that we count on a plate after 24 hours.
 How many cells result from a single CFU after 24 hours. (Remember, the doubling time for E. faecalis is about 50 minutes in the lab).
(To make this problem interactive, turn on javascript!)
- how many times do the cells double... :
24 hours * 60 minutes = 1440 minutes. <br>1440/50 = about 29 - if you double 29 times ... :
it's the same as 2^29
I think I have the answer: 2^29 = about 500 million
So, each colony contains millions of cells ... all of which descended from a SINGLE colony-forming unit (CFU). When we count a plate, we're not counting the number of cells, but the number of colonies, which tells us how many cells there were when the plate started.
photo credits: plate
Copyright University of Maryland, 2007
You may link to this site for educational purposes.
Please do not copy without permission
requests/questions/feedback email: mathbench@umd.edu