Exploring the Fish2Whale Distribution
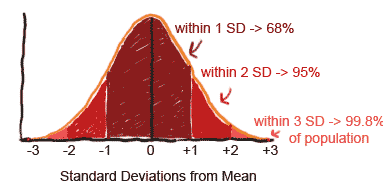
Here is a picture of the distribution of fish sizes for the treatment (Fish2Whale) group. Notice that, if the fish follow an IDEAL normal distribution, we can make a lot of statements about their size distribution (i.e., what percentage of fish are in what size group):

Fill in the Blanks
To make this interactive, turn on javascript!
Recall that when we fed the fish Fish2Whale, the average final length was 25 cm, with a standard deviation (SD) of 3 cm.
what percentage of fish fall between 25 and 28 cm? %
what percentage of fish fall between 22 and 28 cm? %
what percentage of fish are longer than 28 cm? %
Answers: 34, 68, 16
We can do the same thing with ANY ideal normal distribution, such as the height of adult women, or the SAT scores of incoming freshmen...
- 68% of the normal distribution falls within 1 SD of the mean
- 95% falls within 2 SDs of the mean
- 99.8% falls within 3 SDs of the mean
This is sometimes abbreviated as "the 68-95-99.8% rule", or (rather inaccurately) "the 2/3 rule", since approximately 2/3 of the observations lie within 1 SD of the mean.
Copyright University of Maryland, 2007
You may link to this site for educational purposes.
Please do not copy without permission
requests/questions/feedback email: mathbench@umd.edu