Review
The infective dose (ID) for cholera is about 1 million. It would take about 20 generations of doubling for a population starting from a single cell to reach 1 million cells.
 Exponential growth follows the pattern
- Initial Number --> 1
- Number after 1 doubling --> 1×2
- Number after 2 doublings --> 1×2×2
- Number after 3 doublings --> 1×2×2×2
The (untransformed) graph is a line curved up. When the graph is log-transformed, it becomes a straight line (pointing up, assuming the population is growing). This happens because during exponential growth, the population always grows by the same multiplicative factor.
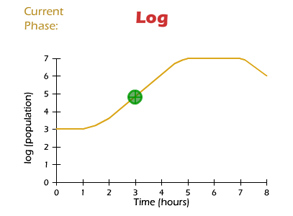 Using knowledge about how the log-transformed graph appears, we can determine whether a bacterial population is in a lag, log, stability, or death phase.
We can determine doubling time roughly by reading it off a graph. To do this, pick a starting population (on the y axis) which falls within the exponential growth window. Find the doubled population and check that it also falls within the exponential growth window. Find the amount of time elapsed (on the x axis) between the two population readings. This is the approximate doubling time.
Another way to estimate doubling time would be to calculate it based on data about how long it takes to get to the infective dose, and how many generations that represents.
Copyright University of Maryland, 2007
You may link to this site for educational purposes.
Please do not copy without permission
requests/questions/feedback email: mathbench@umd.edu