Try it out
 Good news! You will know that you need to make a graph on log paper, because your TA will hand out
log paper. Back in the 1950s, when everyone used slide rules, people actually bought pads of semi
log paper and carried them to math class. But not anymore. So, if you're expected to make a graph
on log paper, someone will have to give you a paper.
Even better news! If you look just below, you will see an image of semi-log paper. That means you can practice making a semi log graph right now.
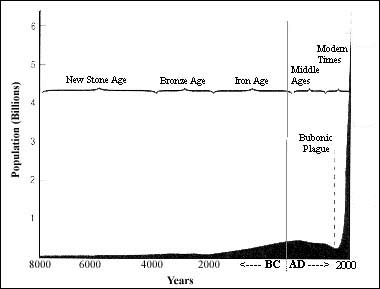
The following table contains data on human population growth over the last 3000 years. Above, this data is plotted on a normal graph. Because the data spans many orders of magnitude, the graph looks kinda empty. This is a good candidate for log transformation -- can you correctly place each point on the semi-log paper below?
| year | 1000 BC | 0 AD | 1000 | 1400 | 1750 | 1850 | 1950 | 1970 | 1980 | 1990 | 2007 |
| popn. size (millions) | 50 | 200 | 300 | 220 | 790 | 1260 | 2520 | 3690 | 4430 | 5260 | 6600 |
Copyright University of Maryland, 2007
You may link to this site for educational purposes.
Please do not copy without permission
requests/questions/feedback email: mathbench@umd.edu