Practice with error bars
Here is a set of data to practice with. If you have any uncertainty as to how to make a bar chart with error bars, I urge you to draw the graph on your own before clicking for the answers. I picked numbers that will not give you too many problems.
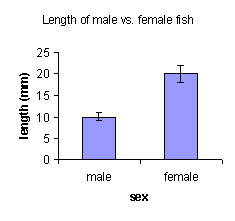
Question: how does final size differ among male and female fish?
|
Use the data in this column to fill out the table on the right. Then sketch the graph on paper, and click on "Show me the graph..." to see if you got it right.
|
Fill out the answers below, draw your graph, then click on the button to compare. To make this interactive, turn on javascript!
What is the largest value for y needed? Answers:
|

Copyright University of Maryland, 2007
You may link to this site for educational purposes.
Please do not copy without permission
requests/questions/feedback email: mathbench@umd.edu