Linear Relationships and Spectros
A common linear relationship used in biology is correlation of the amount of light that some chemical solutions absorb with their concentration.
You see examples of the linear relationship of light absorbance and concentration all the time. If a parent makes up a red cordial drink at a low concentration, children are very quick to complain. That’s because children immediately use their eyes as a spectrophotometer and realize that the amount of light absorbed by the drink is different to what they were expecting. In fact, if the parents have halved the cordial concentration, then the absorbance of the solution would be half, with the drink looking less dark.
A spectrophotometer (affectionately known as “a spectro”) does this same job as the children’s eyes but puts a number on the absorbance (ahh, a numerical variable we can measure!!). The higher the absorbance value, the less light that can get through the solution.
 Key Knowledge: A spectrophotometer is a device that measures how much light a solution absorbs, which often has a linear relationship to the concentration of some chemicals in the solution.
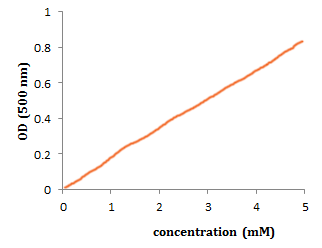
For a standard curve (i.e., a line graph that can used to find out the concentration of an unknown solution), the experimenter decides on the concentrations to be measured (independent variable)  and the output from the spectrophotometer is the value for the dependent variable (called Optical Density or OD). Thus you end up with a graph like this:
Yeah, a linear relationship!! If at higher concentrations the curve does flatten off, don’t panic as this is often is due to the limitations of the instrumentation used at high absorbance values. You should not use data in this region of the graph for calculations.
So there you go, if your parents are trying to rip you off when making up your favorite drink, you now have the science to do an experiment and come back with some objective data to prove your case!
What is the slope of the graph above?
(To make this problem interactive, turn on javascript!)
Before you can even start to answer this, you need to think about units. So, y is measured in OD units, and x is concentration, which ranges from 0 to 5 mM. A useful unit for x would be "mM". Thus the units of the slope are "OD / mM"
- I need a hint ... : Approximately what is the value of y at x=2?
- ...another hint ... : At x = 2, y = 0.4, so the slope is 0.4 / 2 = .2
I think I have the answer:0.2 units OD/mM
In other words, the OD increases by 0.2 units for every additional 1 mM of cordial.
Don’t stress if you are lost at this point–below is the nuts and bolts of using standard curves which does not involve much maths. You don’t have to understand all the maths behind standard curves to be able to use them!! As biologists, we must be able to be able to construct or set up experiments to generate data for a standard curve and use them appropriately.
 Straight Lines/Standard Curves